Reports & Analytics
The Reports page gives you a clear picture of your church's health: attendance trends, membership growth, outreach outcomes, and engagement scores. All data is scoped to your role.
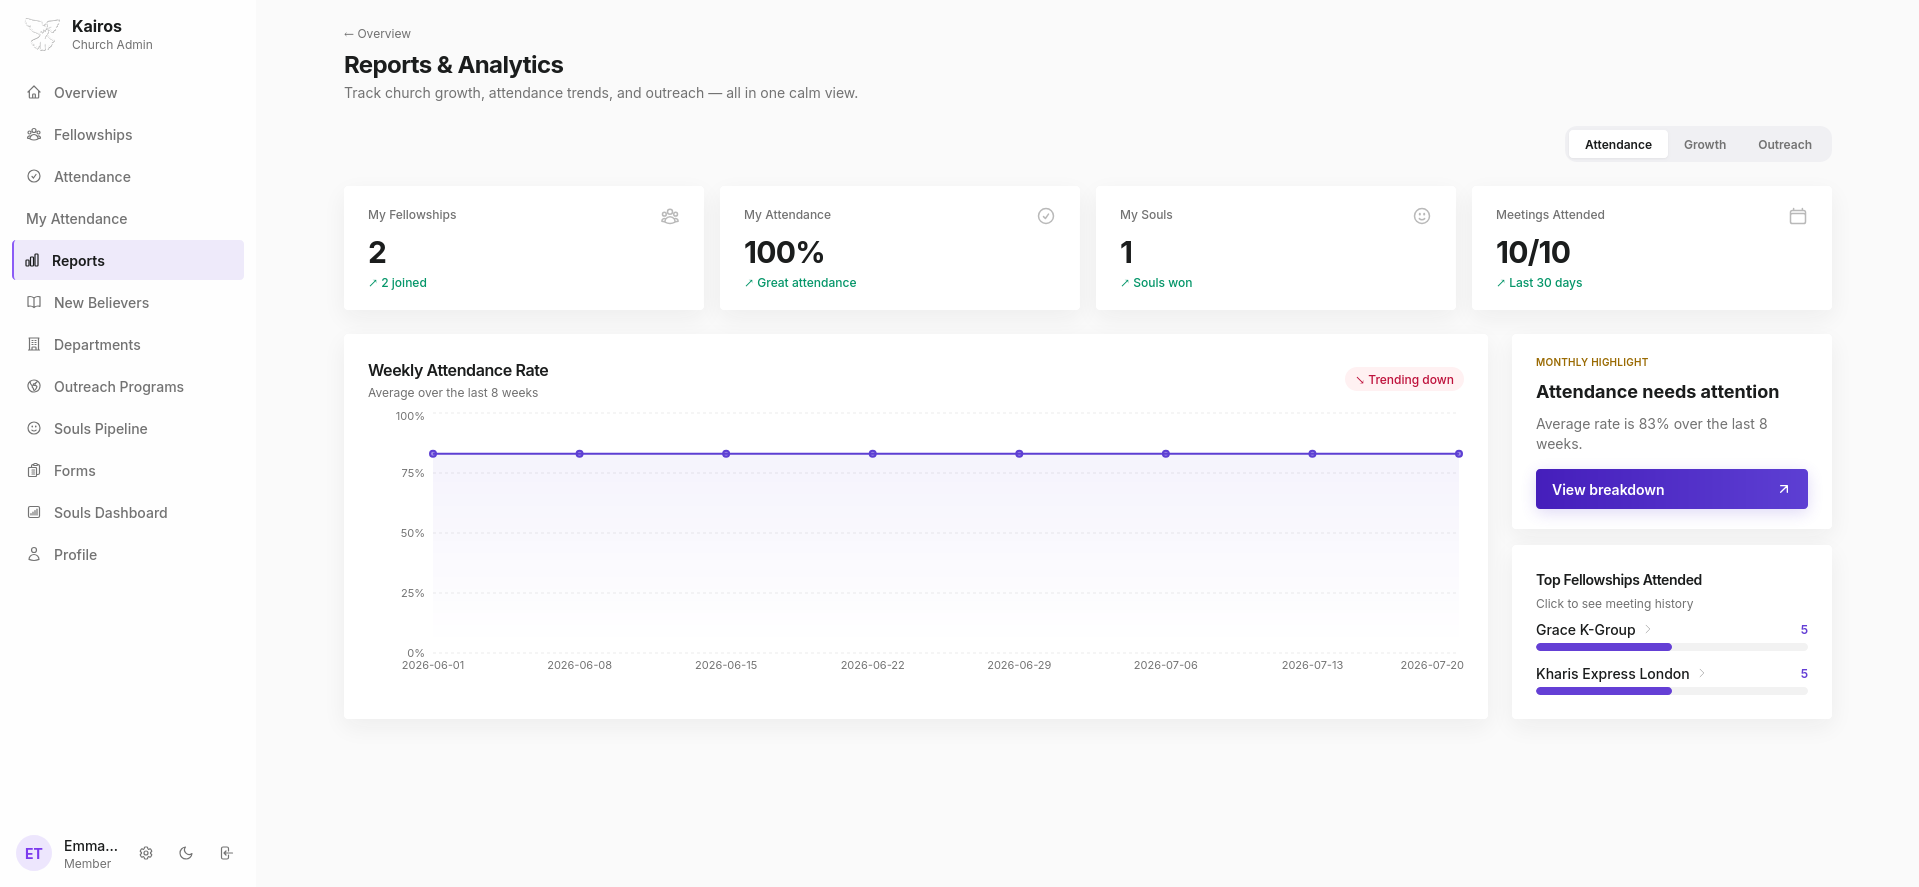
Summary stats
Four headline numbers appear at the top:
| Stat | Description |
|---|---|
| New Members | Members added in the selected period, with month-on-month change |
| Avg Attendance | Average service attendance rate, with trend indicator |
| Souls Reached | Total souls captured via outreach, with conversion rate |
| Growth Months | Number of months of consecutive growth |
View tabs
Switch between three report types using the tabs in the top-right:
- Attendance: service attendance over time
- Growth: membership numbers and new joiners
- Outreach: souls captured, follow-up rates, and conversions
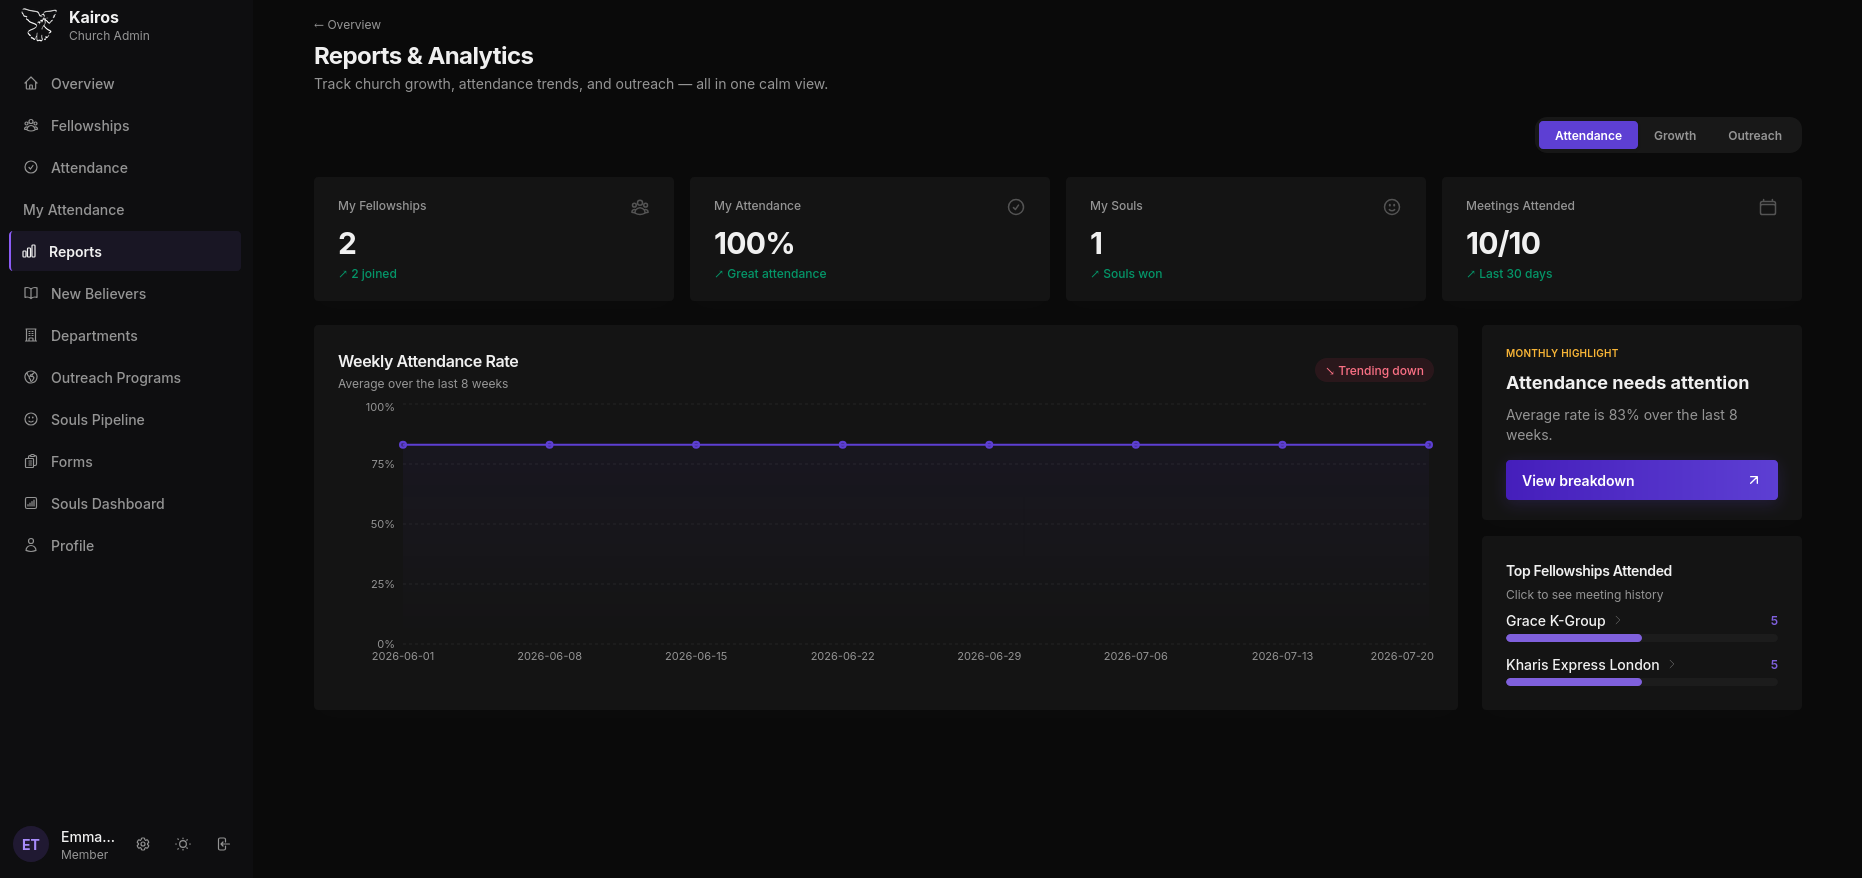
Weekly Attendance Rate chart
The main chart shows average attendance rate over the last 8 weeks as a line graph. Hover over any point to see the exact date and percentage.
If the trend is downward, the chart header shows a Trending down warning in red.
Monthly Highlight panel
A contextual insight box on the right-hand side that surfaces what needs attention. For example: "Attendance needs attention. Average rate is 80% over the last 8 weeks" with a View breakdown button.
Top Fellowships Attended
A bar chart showing which fellowships have the highest meeting attendance. Click any bar to drill into that fellowship's meeting history.
Role-based scope
| Role | What they see |
|---|---|
| Admin | Church-wide data across all branches |
| Pastor | Their branch only |
| Leader | Their department or fellowship only |
| Member | Their own attendance only, via My Attendance in the sidebar |
Members and Reports
Members do not access the main Reports page. Their personal attendance history is available separately via My Attendance in the sidebar, showing their 12-week rate, punctuality breakdown, streak, and service history. Only they, their pastor, and admins can see this.