Souls Dashboard
The Souls Dashboard provides a dedicated analytics view for the souls pipeline, showing how people captured through outreach are progressing through follow-up, and how many are converting.
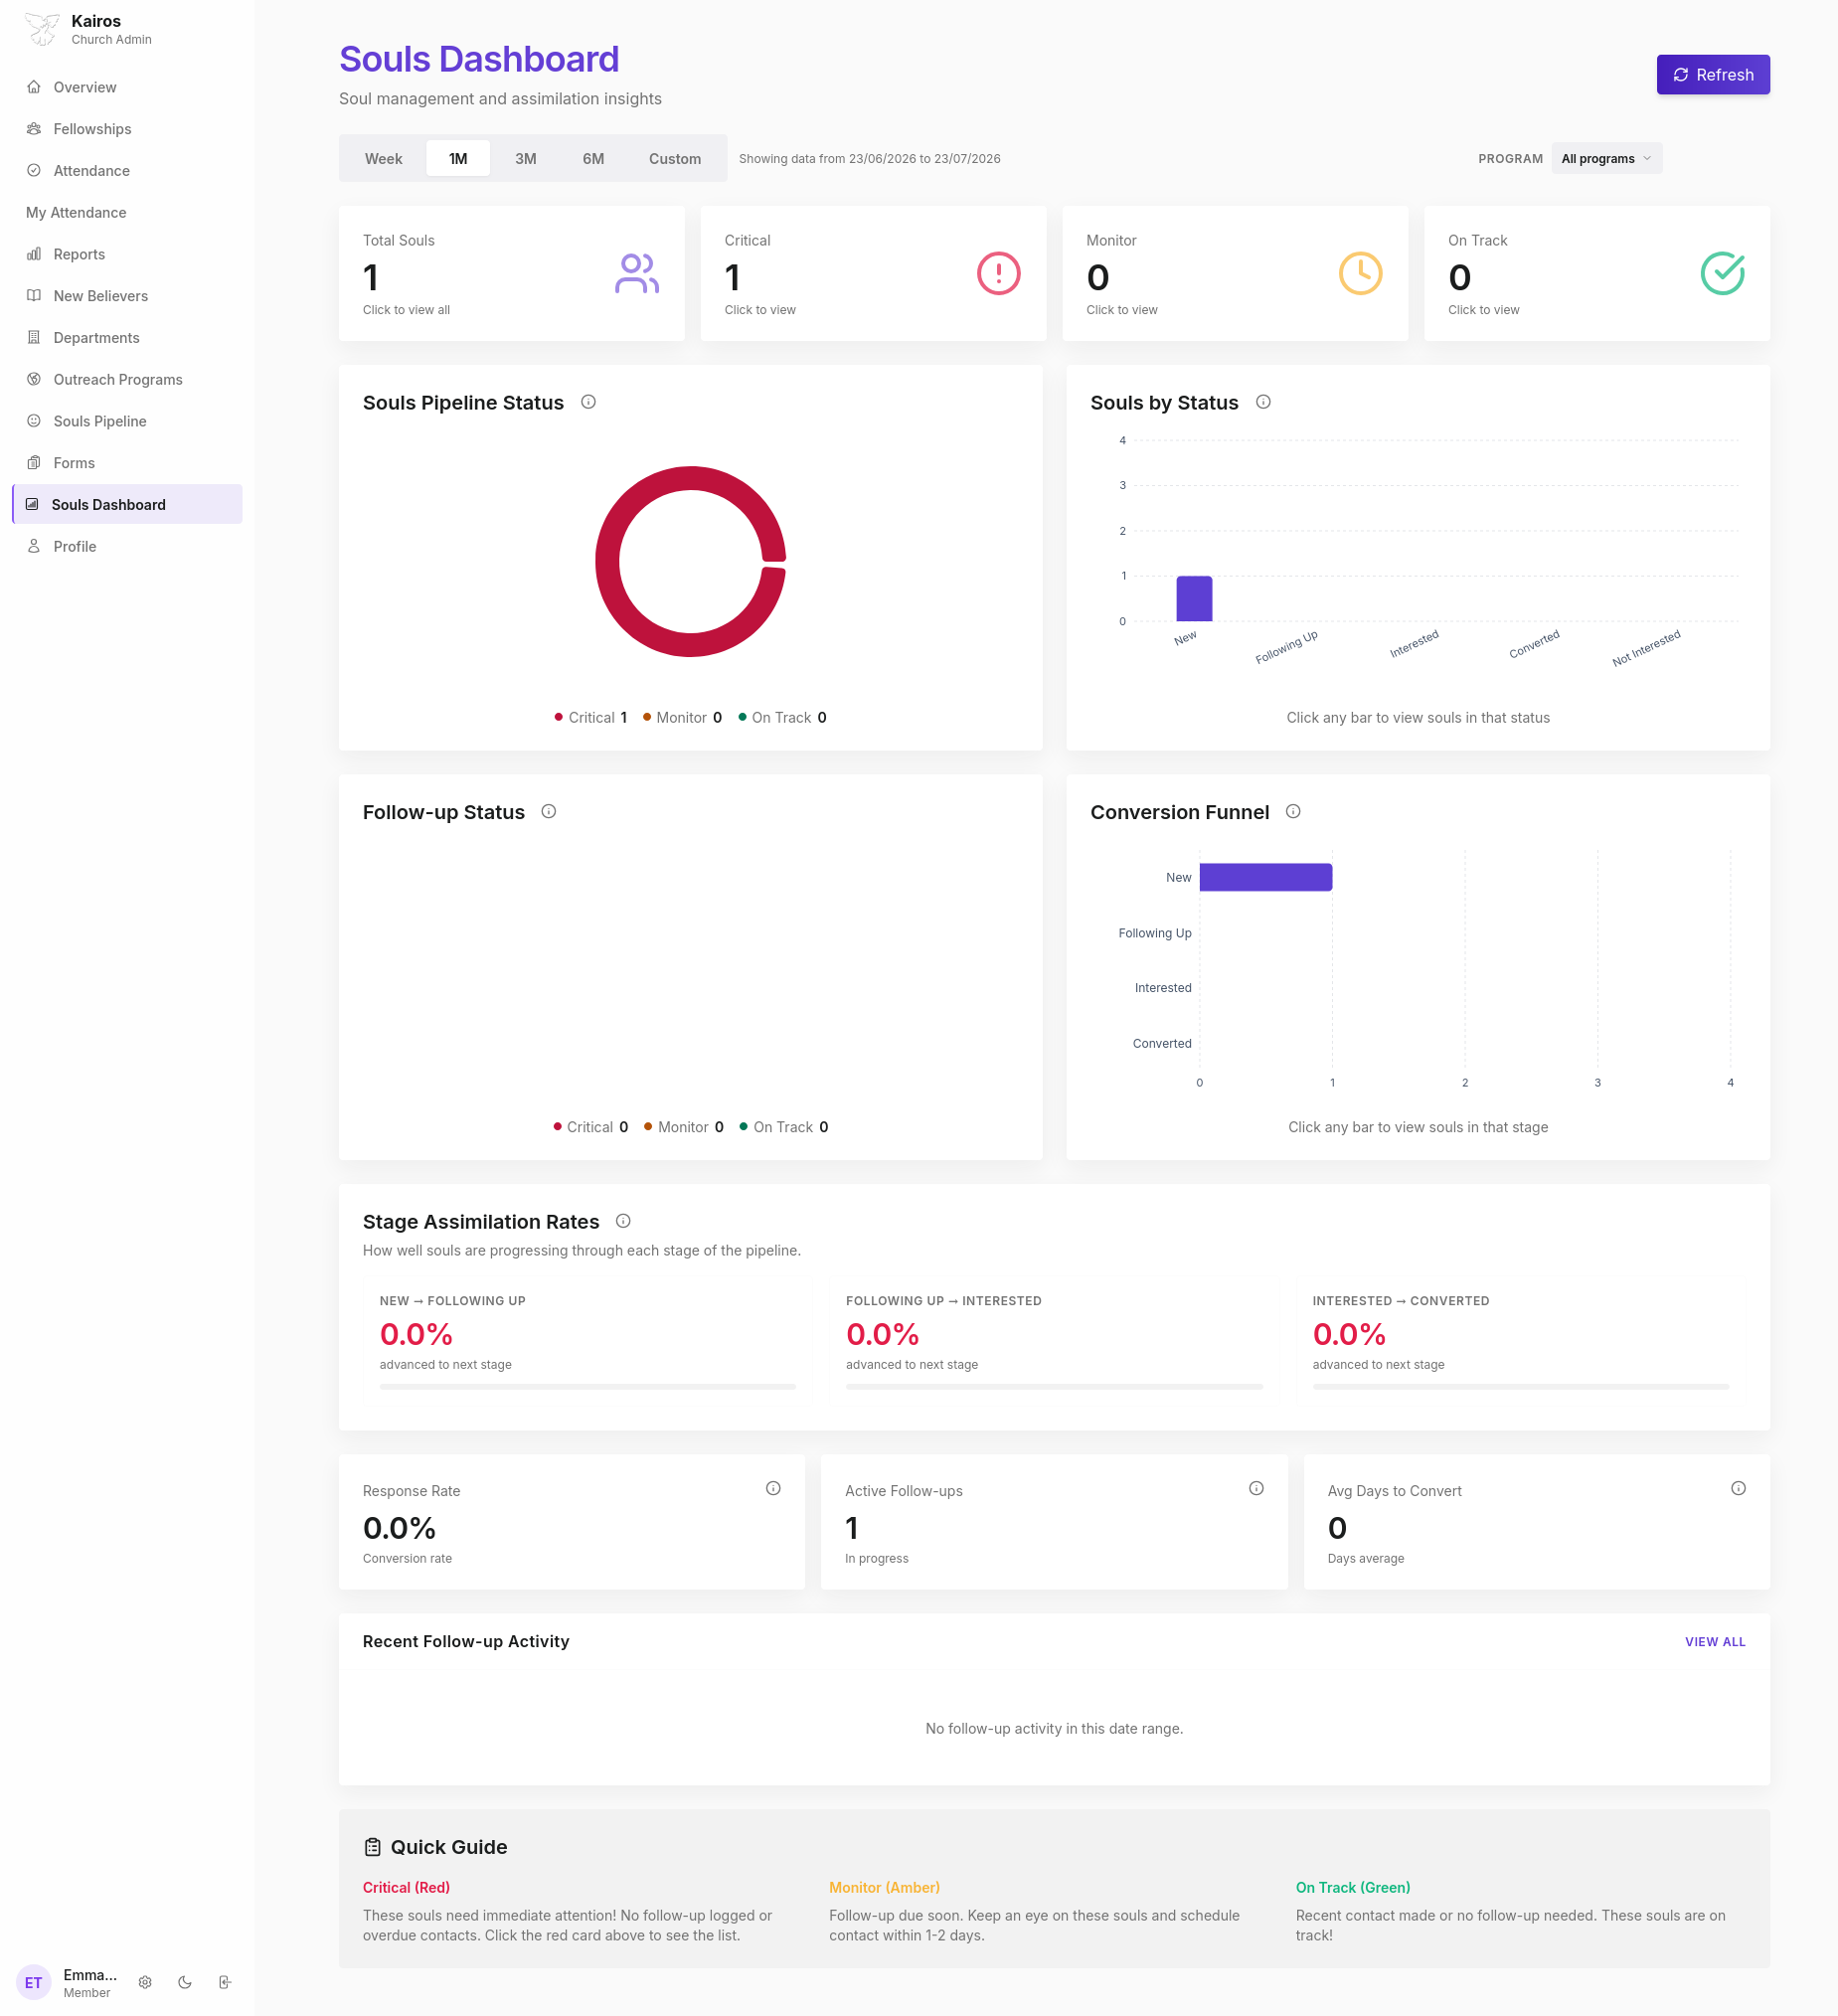
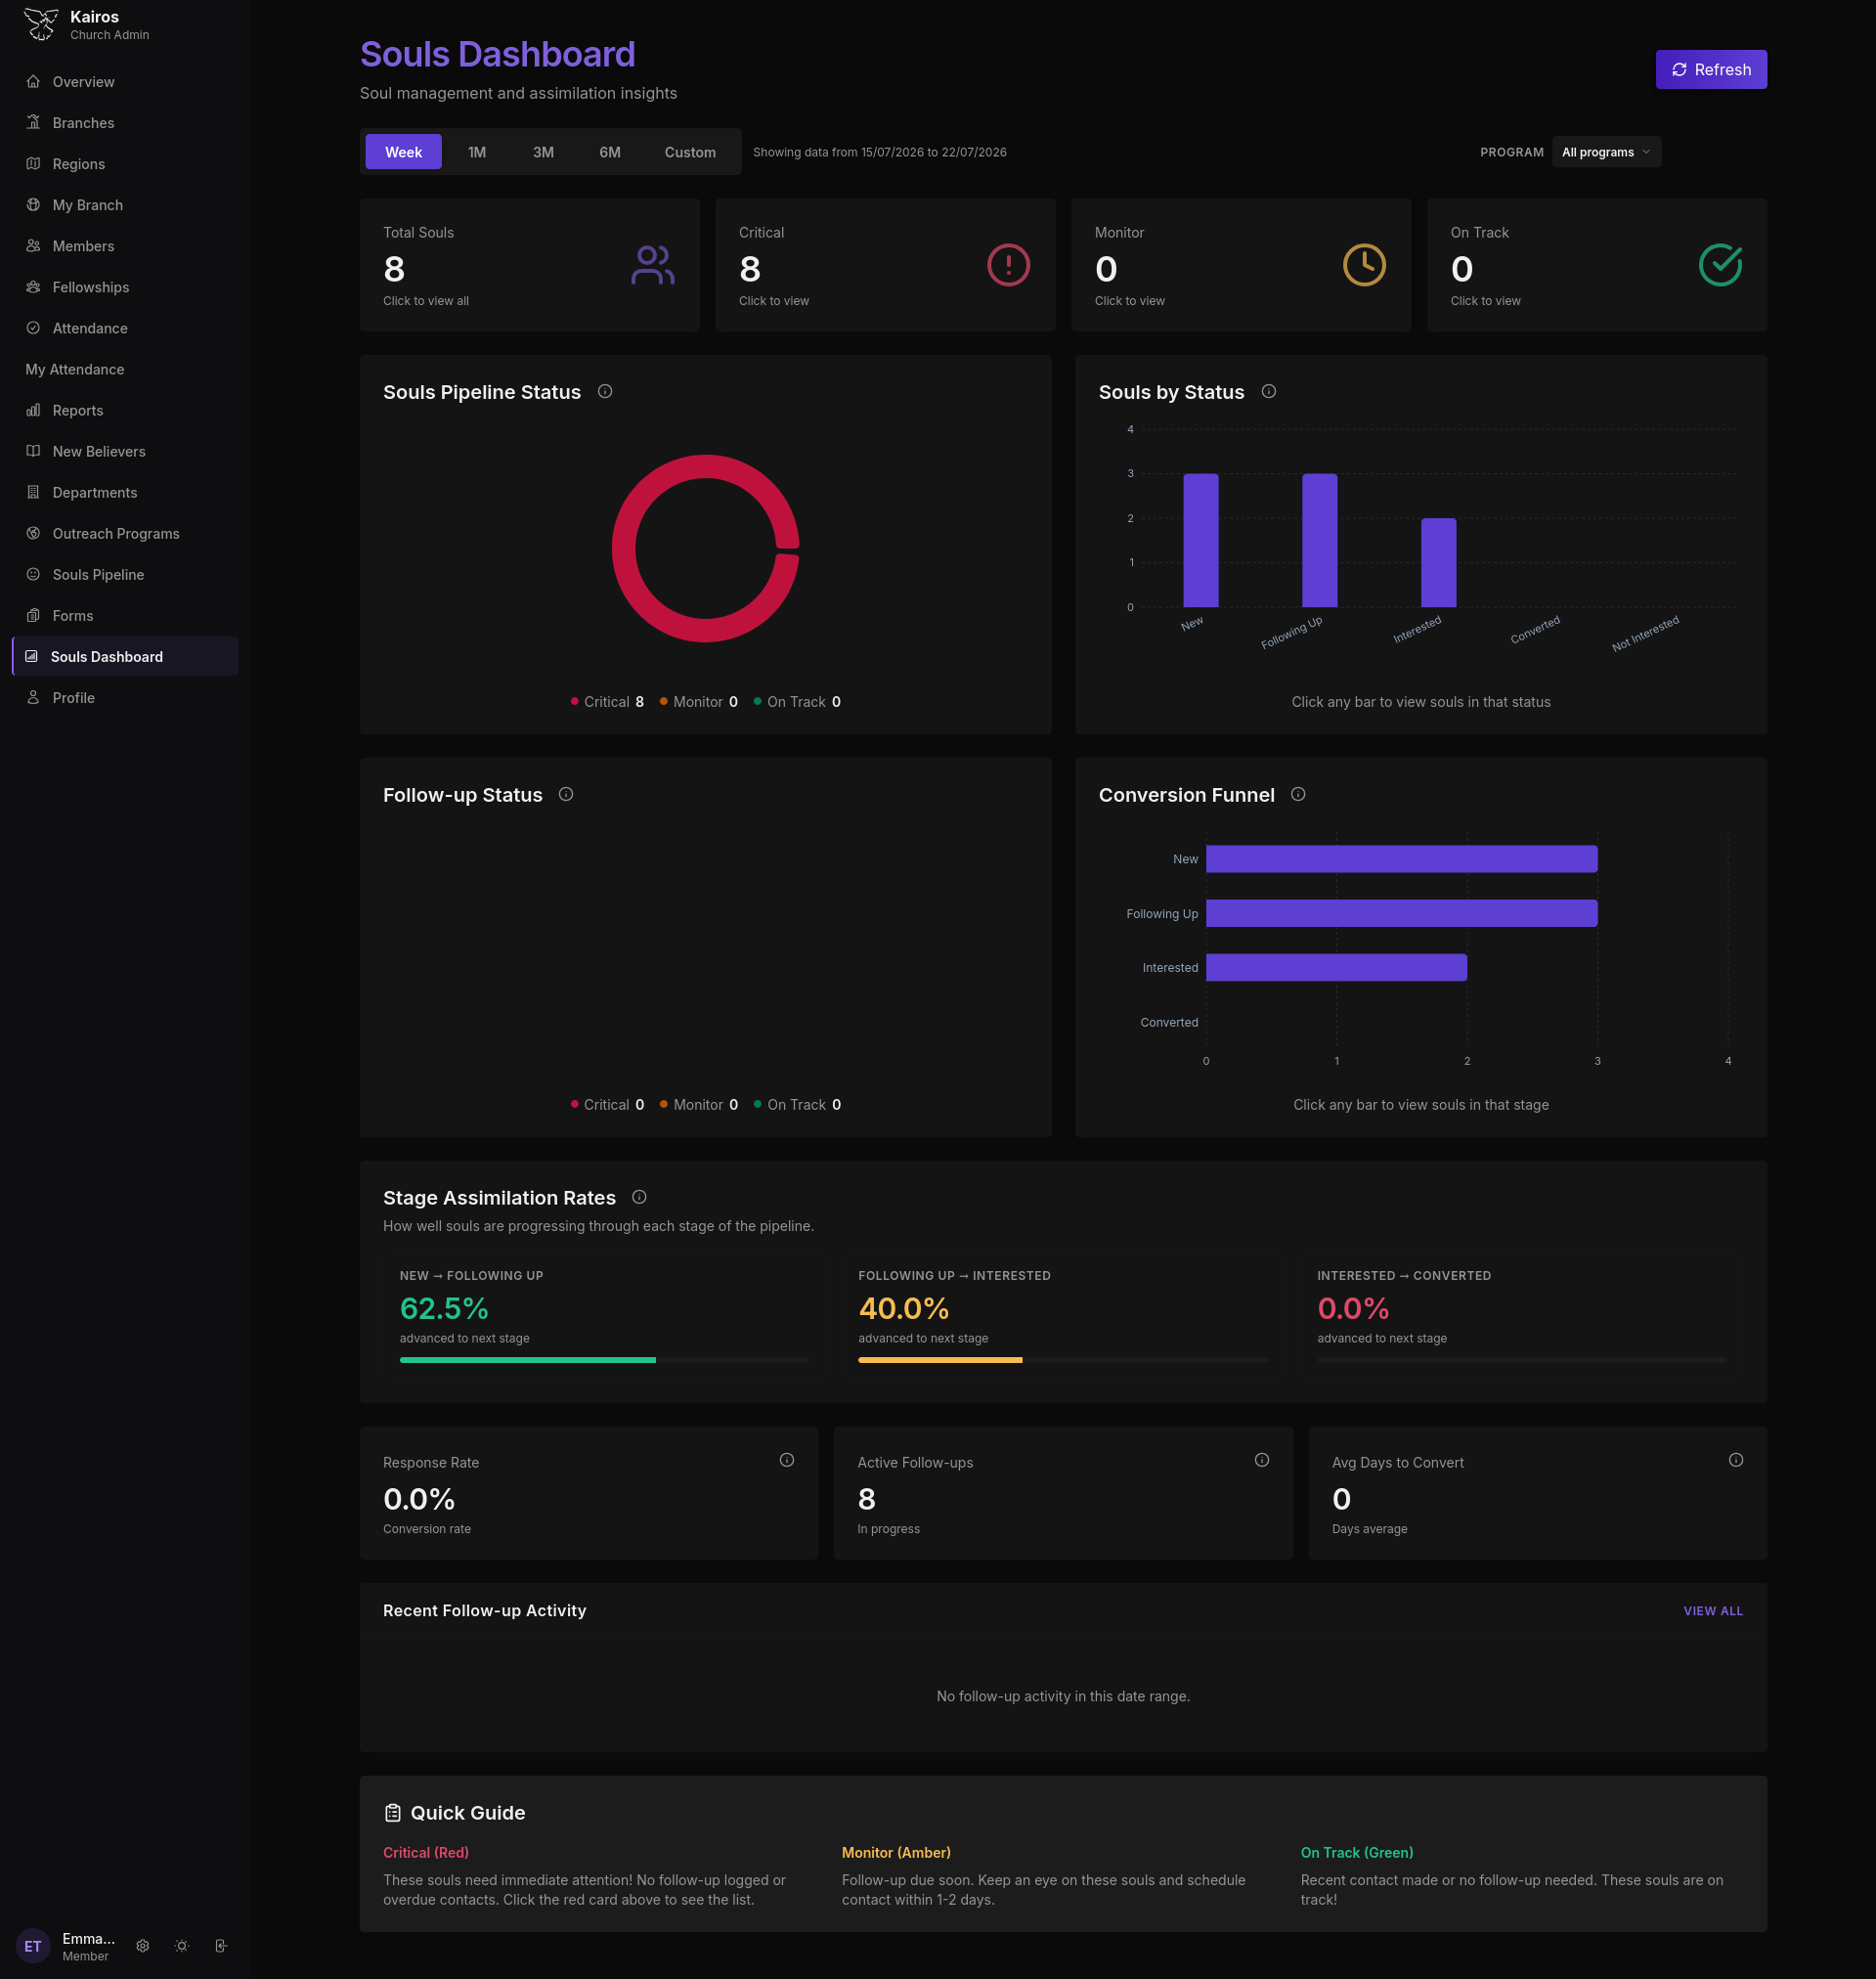
Summary stats
Four headline numbers at the top of the page:
| Stat | Meaning |
|---|---|
| Total Souls | All souls captured in the selected period |
| Critical | Souls with no follow-up in 7+ days; need urgent attention |
| Monitor | Souls flagged for regular check-ins |
| On Track | Souls with recent follow-up activity |
Click any stat card to jump to a filtered view of those specific souls in the Souls Pipeline.
Time range filters
Use the tabs to change the data window: Week, 1M, 3M, 6M, or Custom. Filter by specific outreach program using the Program dropdown on the right.
Souls Pipeline Status
A donut chart showing the breakdown of souls across three follow-up health states: Critical, Monitor, and On Track.
Souls by Status
A bar chart showing how many souls are in each pipeline stage: New, Following Up, Interested, Converted, Not Interested. Click any bar to view the souls in that status.
Follow-up Status
A chart showing the health of follow-up activity: how many souls have been contacted recently vs. those that are overdue.
Conversion Funnel
A horizontal bar chart showing the full funnel from New → Following Up → Interested → Converted. Click any bar to view the souls at that stage.
Stage Assimilation Rates
Shows how well souls are progressing through each stage: the percentage moving forward vs. staying stuck.
Who can see the Souls Dashboard
Pastors and Admins. Leaders can see souls data scoped to their own department's follow-up assignments only.